Nanoindentation
The trend towards miniaturization of components has created a corresponding need for methods of determining the mechanical load capacity of these very small components. This is where nanoindentation comes in: the instrumented indentation test in the nano range. The thinnest layers are tested for hardness, internal bond strength and wear—altogether nanoindentation.
The Diversity of Nanoindentation
The use of material is continuously decreasing with technological innovations. For this reason, nanoindentation is becoming the preferred technique for determining the mechanical properties of materials on the micro and nano scale. The testing systems—so called nanoindenters—cover a wide range of applications:
Measuring hardness and Young's modulus to ISO 14577
Measurement is typically performed with a Berkovich indenter under force control. Very fast measurements are possible, for example with 10-s load, 5-s hold time, and 4-s load removal.
Measurable values:
- Indentation hardness HIT (reevaluate in HV)
- Martens hardness HM or HMs
- Indentation modulus EIT (elasticity modulus)
- Indentation creep CIT or relaxation RIT
- Ratio of elastic deformation component to indentation energy nIT
A total of more than 60 values can be determined.
Micro scratch tests
The tests are typically performed with spherical tips with a radius between 5 and 10 μm. Stress maximum is most often in the coating and not in the substrate. Multiple scans of the surface are possible. The wear on the tip and impact of surface roughness is reduced by the small scratch length.
Measuring stress-strain curves
Together with the Karlsruhe Research Center, a method has been developed that allows the entire stress-strain curve of metals to be determined from indentions made by spherical indenters. It is based on the use of neural networks to identify parameters and it also takes into consideration kinematic hardening.
Vickers hardness
Vickers hardness can be calculated from the indention hardness. A comprehensive study conducted by the Federal Institute for Materials Research and Testing (BAM) used 20 materials to make a comparison between the conventional Vickers hardness method and Vickers hardness calculated using InspectorX algorithms converted with HIT. It showed a mean difference of < 10% vs. 25-30% with other software packages.
[T. Chudoba, M. Griepentrog, International Journal of Materials Research 96 (2005) 11 1242 – 1246]
Depth-dependent measurements with the QCSM module
During depth sensing nanoindentation measurements for the determination if the indentation hardness HIT according to ISO 14577, the load-displacement curve F(h) is measured with a certain maximum load. The hardness can only be indicated for the maximum depth reached in this measurement. A hardness profile along the depth can only be determined by measuring different loads at different locations on the specimen. This is a time-consuming procedure and requires a lot of effort for analysis of the data.
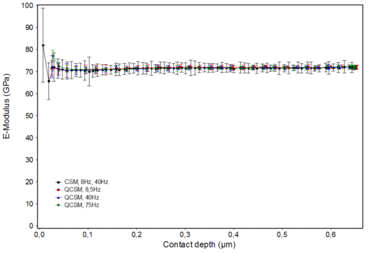
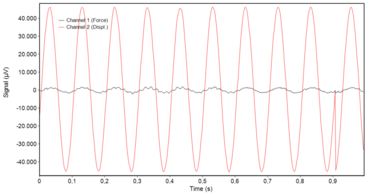
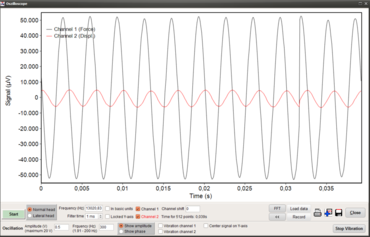
With the CSM or QCSM method, the contact stiffness is already measured during loading as the quotient of force amplitude and displacement amplitude of a small oscillation.
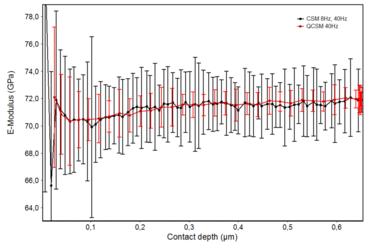
The Continuous Stiffness Measurement (CSM) method adds a continuous small oscillation to the force signal. The ratio of force and displacement amplitude delivers the contact stiffness between indenter and specimen after some corrections, which take into consideration moving mass, frequency and damping coefficient. In the CSM method, the static force during loading is slightly different for every oscillation. This complicates the averaging of several oscillations and the feedback control.
In contrast during the QCSM method, the force is increased in steps and the oscillation is only switched on during a short dwell time between about 0.5 s and 3 s (see principle of QCSM method). This allows an easy averaging of several oscillations and also the feedback control is more accurate. For example, there are amplitudes from 56 oscillations measured at a frequency of 40 Hz and a dwell time of 1.4 s. In the QCSM method the first 20 % of the measured amplitudes are not considered for averaging to reduce the creep influence on the results. This is particularly important for viscose materials.
Nanoindentation: Micro wear investigations with nanometer resolution
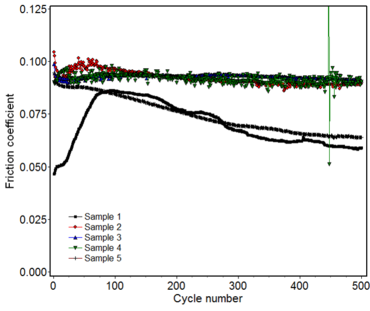
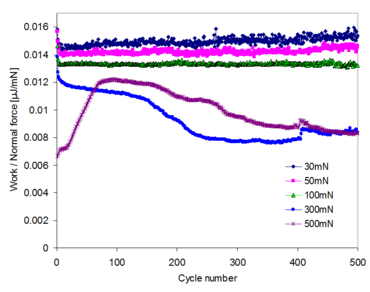
Diamond like Carbon coatings (DLC) are widely used in industrial applications due to their high hardness, low friction and high corrosion resistance. There are still discrepancies between test results of industrial wear tests under application conditions and standard laboratory wear tests.
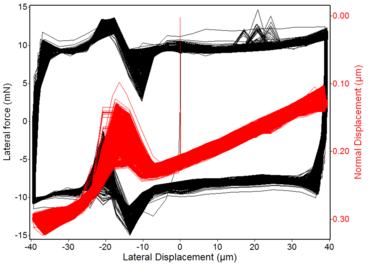
To investigate and understand the dominating wear mechanisms it is necessary to investigate single asperity contacts with contact radii between about 0.1 μm - 20 μm with high resolution. There scarcely exist wear measuring techniques in the load range below 1 N with nanometer resolution in the displacement measurement.
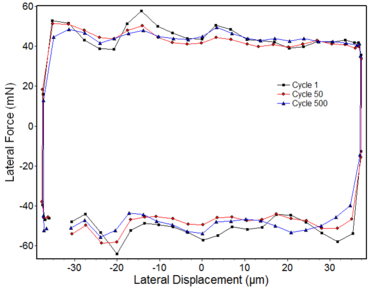
Nanoindentation in combination with high resolution lateral force-displacement measurements can now be used for such investigations.
Specimens, indenters, normal forces
| Parameter | Film Material | Film thickness µm | Hardness GPa | Young's modulus GPa | Yield strength GPa | Poisson's ratio |
| Sample 1 | a-C:H | 4 | 14.5 | 120 | 10.9 | 0.2 |
| Sample 2 | a-C (high sp3) | 5 | 50.0 | 542 | 30.1 | 0.2 |
| Sample 3 | a-C | 3 | 15.0 | 170 | 8.8 | 0.2 |
| Sample 4 | a-C:W (17%) | 3 | 14.5 | 140 | 9.5 | 0.2 |
| Sample 5 | a-C:H (structured) | 4 | 12.2 | 103 | 9.0 | 0.2 |
- Indenter 1: Diamond, 67 μm initial radius, 5 forces 50 mN – 1000 mN
- Indenter 2: Diamond, 6 μm initial radius, 7 forces 5 mN – 200 mN
- Indenter 3: Hard metal, 100 μm initial radius, 4 forces 100 mN – 1000 mN
Summary of wear rate results
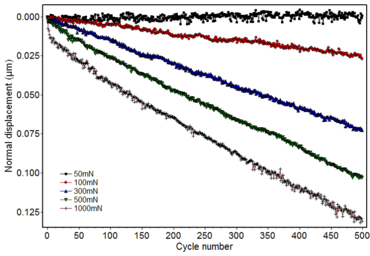
- Wear during slow oscillatory motion and about 50 % humidity starts for DLC coatings when the contact pressure is about 10 % - 30 % of the yield strength.
- The wear mechanism changes when the contact pressure reaches the yield strength.
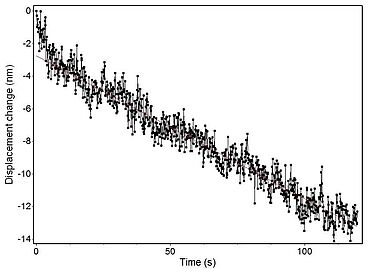
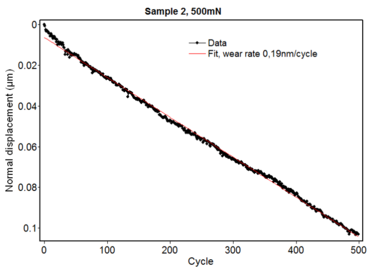
- The wear rate is approximately proportional to the contact pressure for smooth surfaces. The depth increase per sliding movement is smaller than 0.15 nm and therefore only 0 - 2 atomic layers. Wear is a continuous process without particle degradation.
- Wear starts at a lower normalized contact pressure for hydrogen-containing DLC.
- Higher hardness level is not advantageous for this type of wear. At equal load the (absolute) wear rate for hard coatings is approximately the same as for soft coatings.
- Counterparts made from hard metal induce about 2.5 times higher wear rate of the coatings than diamond tips.
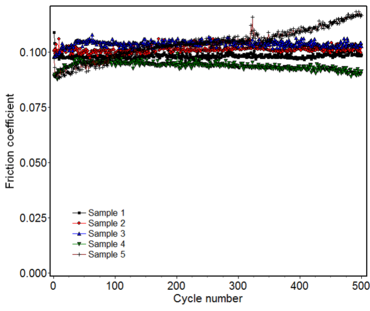
- For the investigated type of wear there is no correlation between wear rate and friction.
Mapping of nanoindentations – tests
The weakest element in a system determines it‘s behavior during loading. Therefore global test methods are advantageous. The mapping of mechanical properties with a nanoindenter is a step towards global characterization.
Below is an measurement example of a fused silica specimen with indentations:
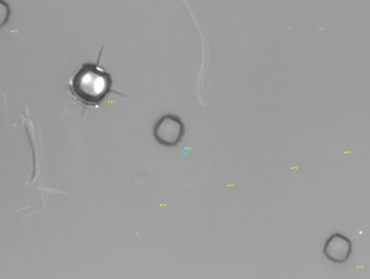
Several indentations have been imposed on a fused silica specimen with a spherical indenter of about 10 µm radius. The same indenter was also used to scan the specimen. Fig. 2 shows the glass surface with indentations of 800 mN (upper left) and 2x 500 mN. Additional indentations at lower forces have been fully elastic. One indentation at 200 mN is hard to recognize optically, however, a small plastic deformation of a few nanometers can be measured.
- The measurements were carried out with a contact force of 15 mN. This is a relatively large scanning force but the contact is fully elastic and it allows a better measurement of the lateral force for the expected small friction coefficient. The scan range corresponds to the image size of 97 µm x 77.5 µm for the optical image with the highest magnification of about 3350 on the screen. The other test parameters were as follows:
- 45 lines
- Scan time per line: 25 s (for high resolution)
- Data rate 8 Hz
- Offset 10 % (additional scan length at both sides outside the analyzed range to exclude start-stop effects)
- Oscillation frequency 40 Hz
- Amplitude 0.1 V (corresponds to about 5 nm displacement and 0.8 mN force amplitude)
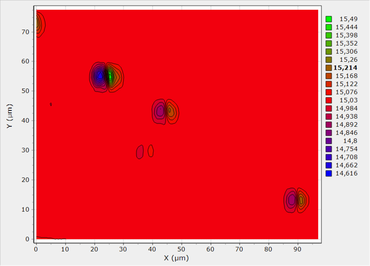
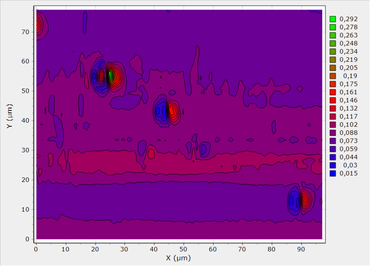
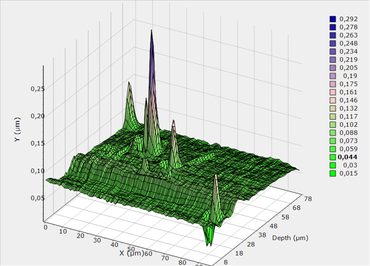
The mapping of the normal force signal allows a clear detection of the indentation positions because the force becomes lower when the indenter slides into the indentation and becomes bigger when it slides out. The force control is not fast enough to cancel out this effect.
Here, a slight distortion is also visible at the position of the 200 mN indentation. A similar result is available when only the force amplitude of the oscillation is presented (fig. 4).
For the determination of the Young’s modulus not only the contact stiffness is necessary – which can easily be obtained from the measured force and displacement amplitudes – but also the correct indentation depth. Therefore a zero point correction for the displacement measurement is necessary. which can be carried out in the same analysis window. The result of the Young's modulus mapping of fused silica is shown in fig. 5. The expected value of 72 GPa is well attained over the complete area with the exception of the indentation positions. There, the analysis model which assumes a flat surface is incorrect and therefore the results are too big.
The friction coefficient between diamond tip and glass is obtained from the ratio of lateral and normal force. It is shown in Fig. 6 and 7. At the indentation positions, the friction decreases in the direction of movement according to fig. 3 and increases when the tip moves out of the indentation.
In the flat area the friction coefficient is between 0.7 - 0.8. Only in the front part of the specimen it is a little lower. The reason for this is not clear.
The measurements of all the presented properties were carried out during one scan, which was relatively long at about 2000s. A considerable reduction of the scan time is possible; however, the faster movement may result in increased scatter.
Additional nanoindentation applications
- Coating development from soft (polymer) to hard (diamond-type coatings)
- Determination of critical stresses for cracking or plastic deformation
- Hard material coatings for tools and as scratch protection
- Protective coatings on glass
- Paints and sol-gel coatings
- Automated measurement of hardness traverses on transverse cross-section
- Nano coatings for sensors and MEMS/NEMS
- Biological materials
- Matrix effects in alloys (mapping)
- Ceramic materials and composites
- Ion-implanted surfaces
- Damage analysis in microelectronics
