2D Digital Image Correlation
Along with strain measurement, you obtain valuable additional information on specimen behavior!
ZwickRoell digital image correlation makes local strain visible in 2D across the entire specimen surface.
Description Examples Difference 2D / 3D Specimen preparation Procedure Analysis tools Extensometers

What is 2D digital image correlation?
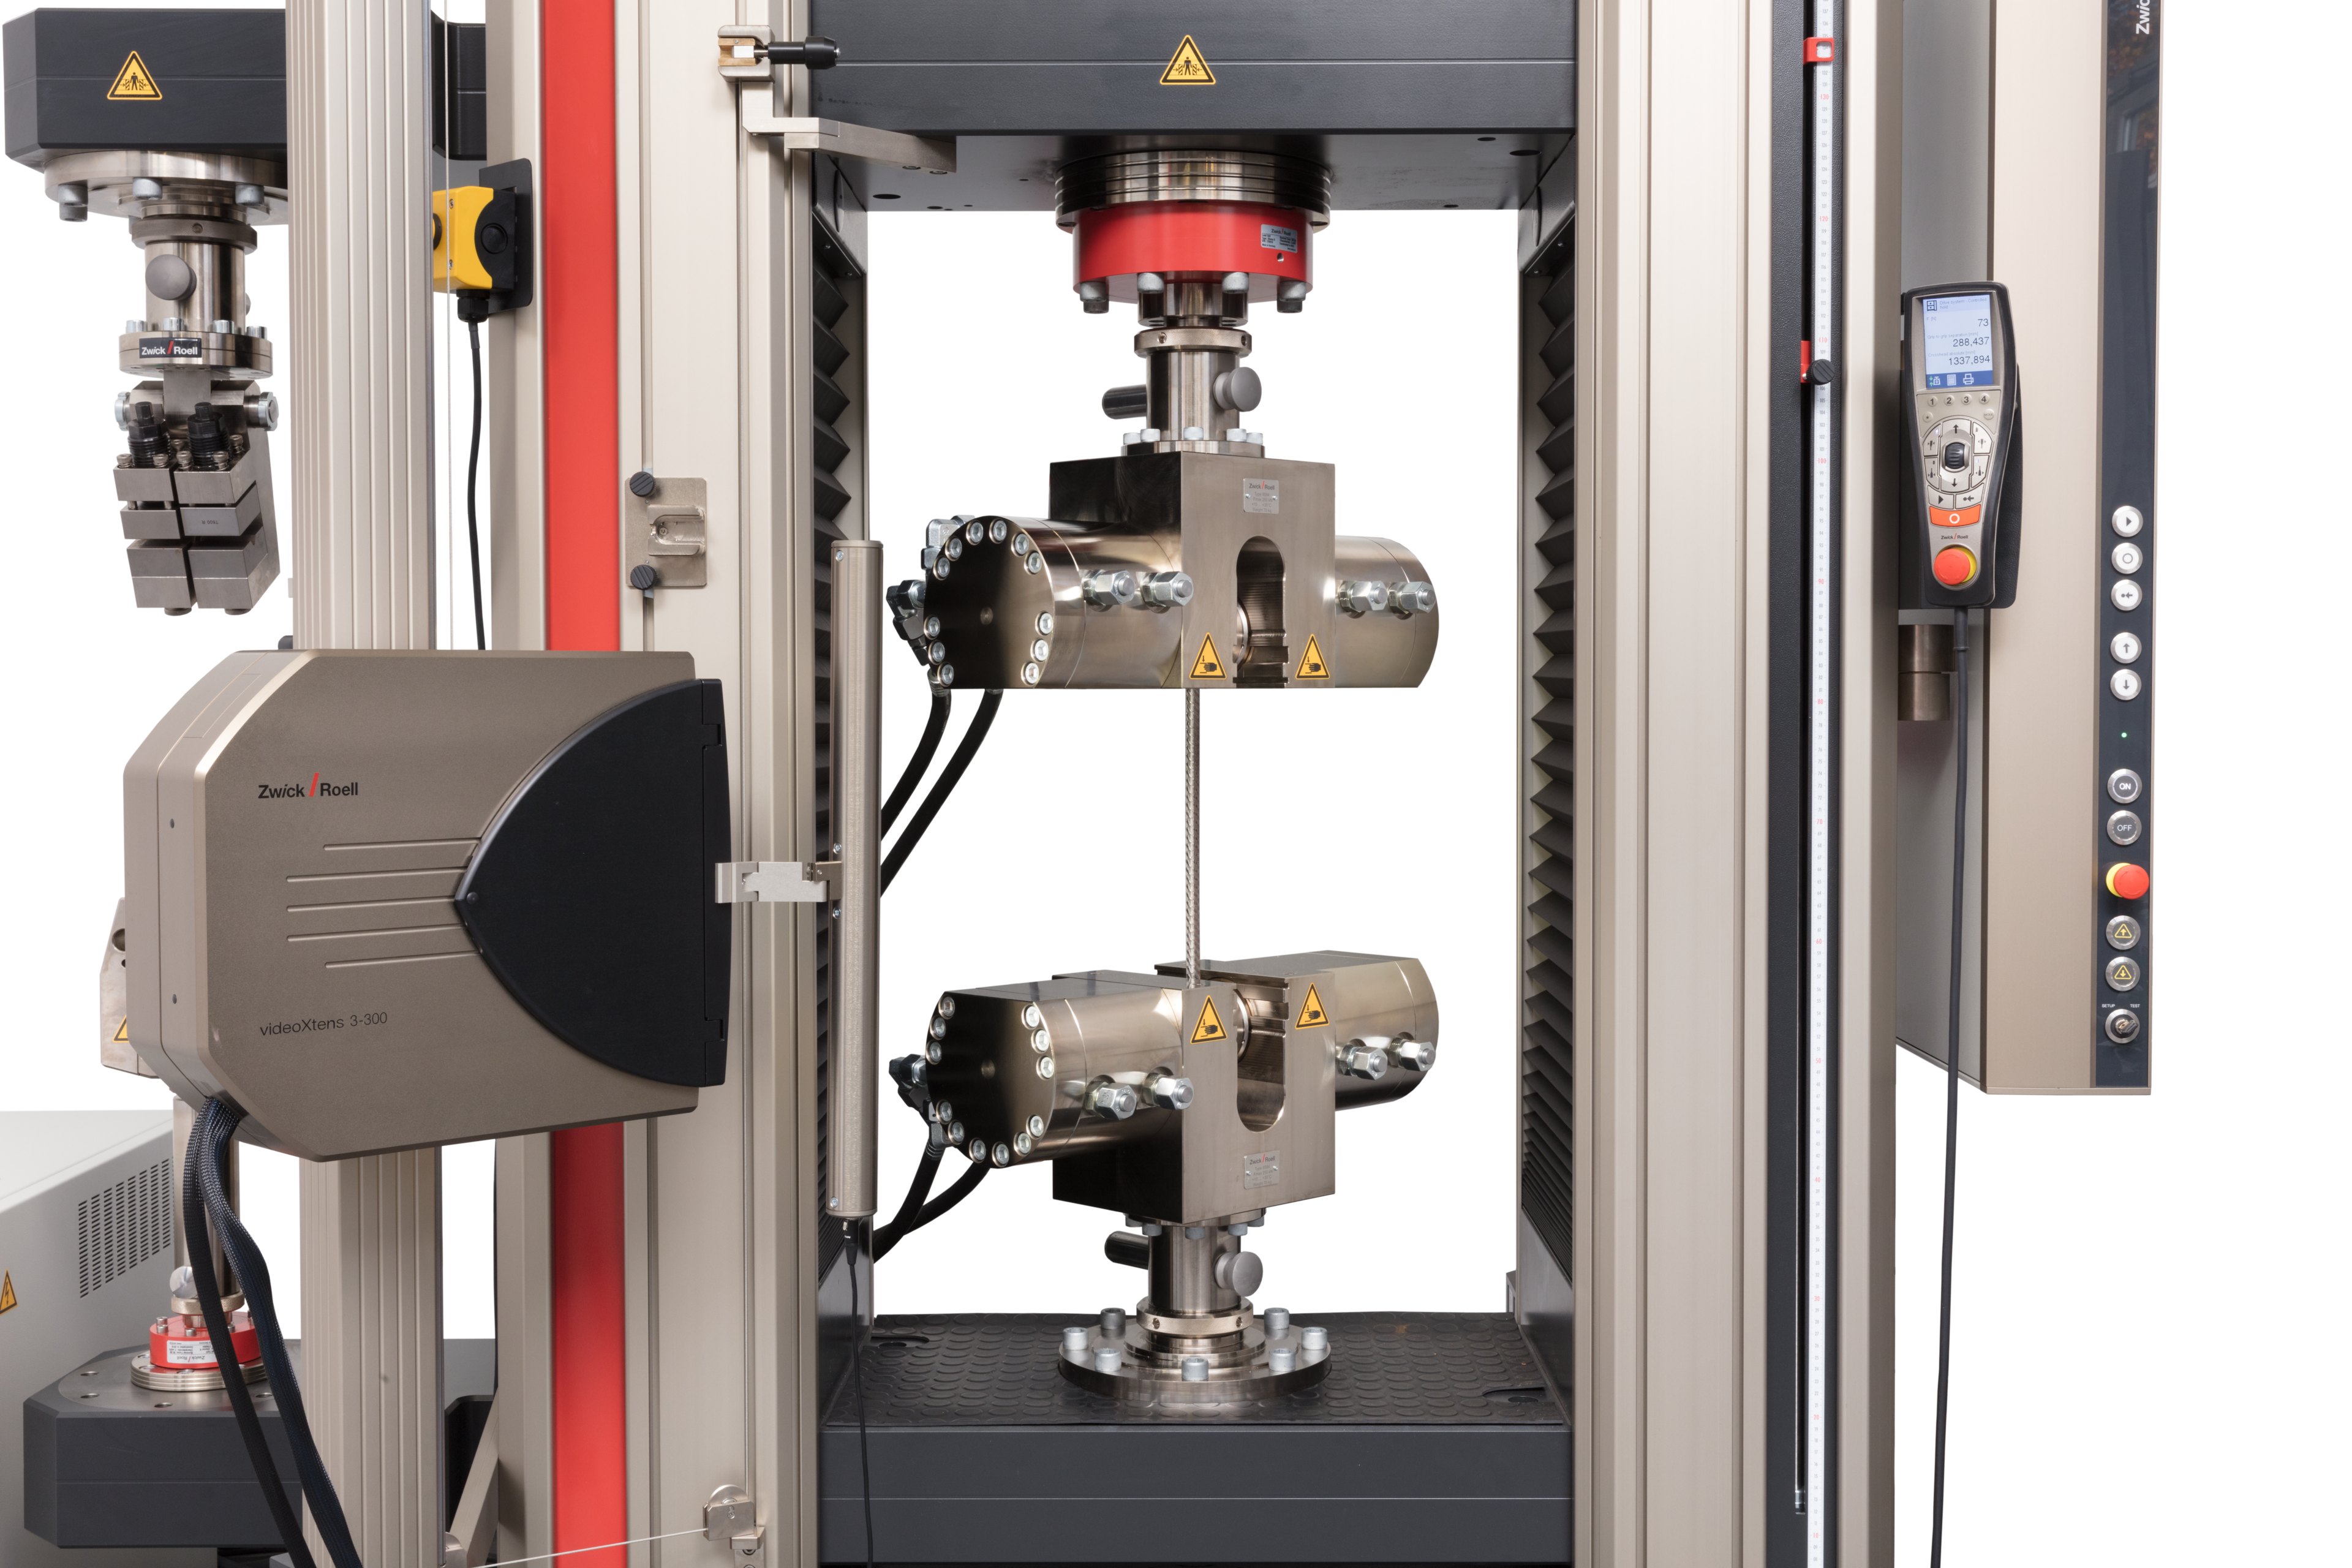
2D digital image correlation visualizes deformations and strain over the entire visible specimen surface. The non-contact videoXtens extensometer records image series during the test, compares image by image, and calculates the displacement in a pre-defined facet field, where each facet includes a specified number of camera pixels. This data is used to create two-dimensional color strain maps, which allow you to analyze the specimen behavior at a glance.

Where is digital image correlation used?
ZwickRoell 2D digital image correlation (abbr.: 2D DIC) is used for analysis of the specimen behavior under load. The specimen behavior is visualized in color in the software and provides indications of inhomogeneous local strains and other special features. You can evaluate these local strains more precisely using various analysis tools, such as virtual gauge lengths or virtual strain gauges.
Digital image correlation is also used to verify the results from the live strain measurement. In addition, errors in the test arrangement, such as inaccurate specimen alignment, quickly become visible.
ZwickRoell 2D DIC is a software option for the videoXtens. The full-surface evaluation leaves plenty of scope for the specimen shape: Even components, complex specimens with recesses or non-homogeneous materials are analyzed with digital image correlation.
2D digital image correlation applications
- The use of cost-efficient virtual strain gauges for shear tests with notched specimens to ASTM D5379 and ASTM D7078
- Open-hole tension (OHT) strength test to ASTM D5766 with determination of the stress concentration near the hole
- FE (finite element) model validation: Comparison of the displacement and strain field through the FE simulation
- Determination of stress-strain curves (true, technical)
- Evaluation of specimen failure through assessment of the point of fracture, for example through determination of a local strain maximum at the point of fracture
- Verification of the heterogeneity of the material and identification of local failure

Difference between 2D and 3D digital image correlation
Many applications do not require 3D DIC. Two-dimensional digital image correlation is sufficient if the measurement surface is flat and there is no twisting, no tilting of the surface, and no significant lateral specimen movement occurs during the test.
A 3D DIC system is used for three-dimensional measurements, for example of components and round specimens, and requires special hardware and software. Systems for 3D digital image correlation are connected to the ZwickRoell testing machine via a module.

Simply see more: the 2D DIC software option from ZwickRoell
The 2D digital image correlation option does not require additional hardware. The software option is simply combined with the videoXtens and expands the functionality of the already installed strain measurement system.
It allows for live strain measurement with a single extensometer, after which the 2D DIC analysis can be carried out.
ZwickRoell array systems offer you high resolution combined with a large field of view. They include several cameras, such as the videoXtens 2-150 HP, which allow you to simply see more in 2D DIC mode.
One software for all of your tasks: testXpert
The 2D digital image correlation option is fully integrated in testXpert. This means that with just one software program, you can perform live measurements and 2D DIC analyses. All measured values, test results and images are stored, managed and evaluated together. The strain values obtained from the 2D DIC analysis can be displayed in the stress-strain curve and evaluated. This makes it a powerful option.
- Measured values, test results and images are stored, managed and evaluated together. You can easily and extensively analyze all measured values with each other. The strain values obtained from the 2D DIC analysis can be displayed in the stress-strain curve and evaluated.
- You will reach your goal quickly and with just a few clicks: by specifying a workflow, you are guided step by step from setup to analysis and display of the measured values.
- Prepare analysis parameters once, then save them in testXpert and use them over and over.
- Reliable results: the measured values resulting from digital image correlation are synchronized with the measured values from the testing machine.
- A new specimen can be created via test re-run for each different evaluation. This makes the evaluation accessible at any time.
2D Digital Image Correlation
DIC analysis range
Analysis tools
Graphical evaluations
Various analysis tools for 2D digital image correlation (DIC)
Drag & drop
Cutting line stack
Virtual strain gauge
What is special about the 2D digital image correlation cutting line?
With the cutting line, strain progression is displayed along or diagonally across the specimen. The cutting line deforms along with the specimen. It is therefore not a fixed part of the image, but rather a line that actually follows the behavior of the specimen throughout the test.
One special function of the cutting line is the cutting line stack: selected time steps can be displayed in a diagram, allowing you to see the development of the cutting line over time.

What makes virtual strain gauges so efficient?
Virtual strain gauges are efficient because they provide a cost-effective alternative to adhesive strain gauges. This eliminates the time required to apply the strain gauges. An extremely effective analysis tool for digital image correlation.
The virtual strain gauges are flexible: position, size and angle are individually determined. They can also be placed on top of each other, whereby two virtual strain gauges create a biaxial strain gauge with measuring grids oriented at 90° to each other.
In addition to local strain information at the strain gauge position, 2D DIC also provides a view of the entire specimen.

What is the benefit of vector maps?
Vector maps display the main strain directions. This makes the strain conditions visible over the entire evaluation range and you quickly gain a good overall understanding of what is going on with the specimen.
The function is an effective extension of the visualization options within digital image correlation.