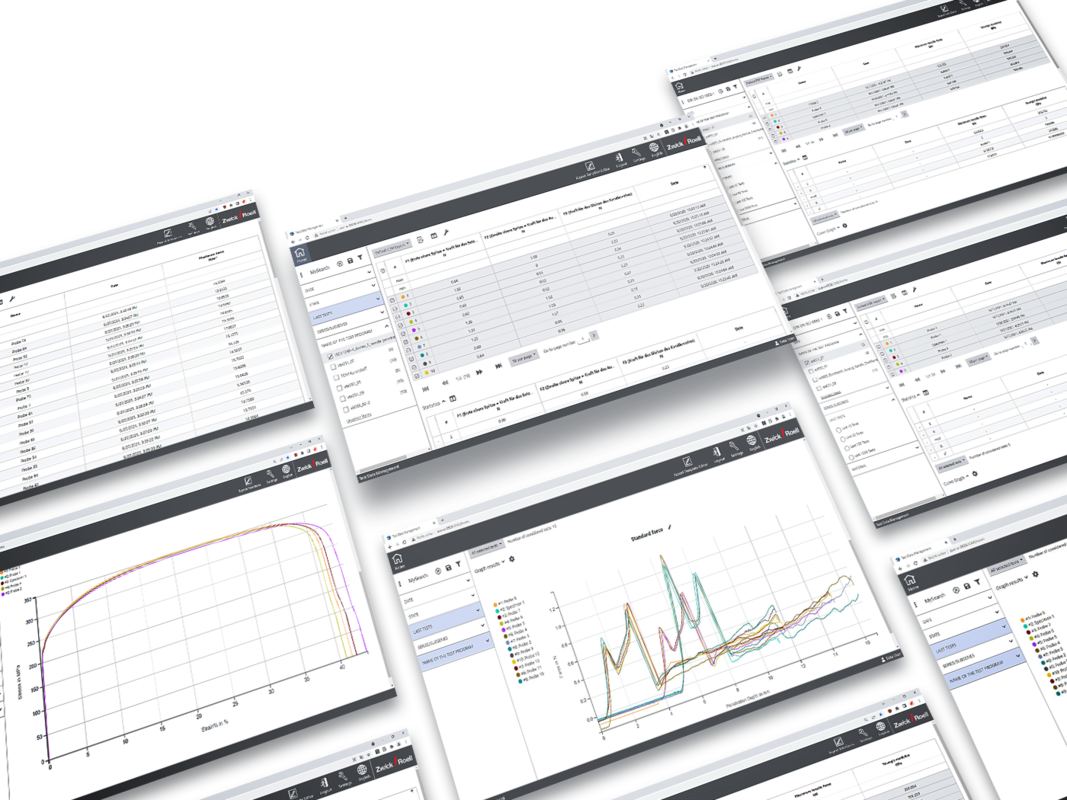
testXpert Analytics
The new testXpert Analytics analysis platform provides centralized access to all test and machine data. The data is easily made available and always up to date via a web browser.
Test Data Management Trend Analysis Fatigue Data EvaluationCondition Monitoring

Test Data Management: all your test data at a glance
Test Data Management provides you easy and secure access to all your test data and results for longterm and reliable transparency.
All your test data is saved in a database. With user-specific filters, you can efficiently create individualized test reports for internal and external quality control and documentation purposes, ultimately saving valuable time and increasing repeatability. Test Data Management allows you to quickly implement quality control processes and analyze any quality deviations at a glance.

Simple and flexible access to all test data
Test Data Management provides:
- Comprehensive analyses, representations and reports
- Simple export of all test data and longterm analysis
- Intuitive operation
- Intelligent search criteria allow you to quickly search and find your test data
- Centralized and convenient access to all test data via a standard browser
- Simple setup of a comprehensive test report
- Access possible from every PC in the company network
- All test and machine data is accessible, regardless of testXpert version
It works like this: click on the browser and all testing machine and testing instrument data relevant to your test is displayed. Test Data Management not only offers comprehensive analyses, it also displays and logs test data that can be exported to formats such as Excel and PDF. Various tabular, statistical and graphical displays facilitate the selection of different test types and data.


Trend Analysis is a simple statistical process control (SPC) chart for early detection of deviations in your quality requirements. This allows you to optimize your processes in a timely manner, avoid waste and save costs.
In the case of batch testing, you can release these with a quick look at Trend Analysis and save valuable time.
Through simple longterm display of your quality criteria in Trend Analysis, you can reduce your testing efforts while maintaining the same level of quality or quickly evaluate different suppliers.

The test data generated with testXpert R is seamlessly transferred and integrated in the evaluation, and therefore does not have to be prepared separately. testXpert delivers the test data in the exact format required by the Fatigue Data Evaluation solution.
The test results on which the calculation of the S-N curve is based are visible to you in parallel to the curve and you can select them using the filter and selection functions.
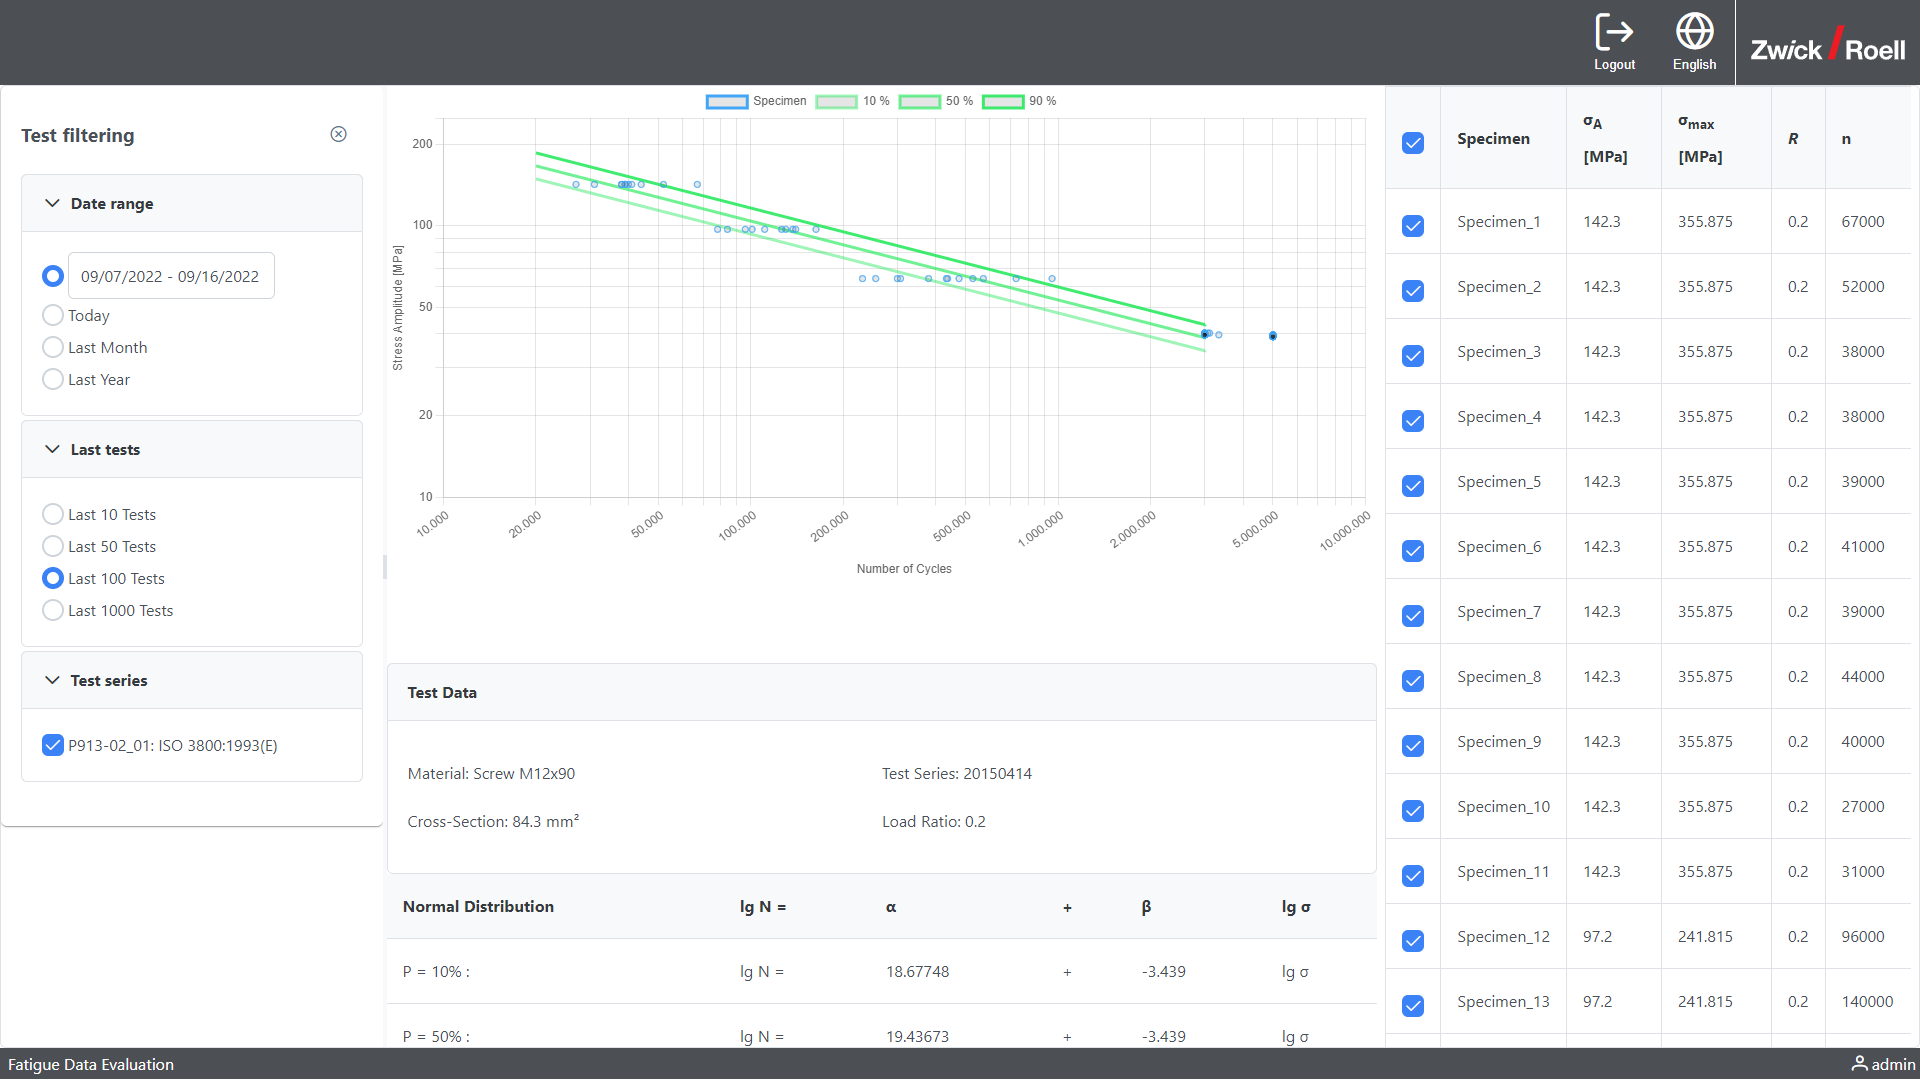
S-N curves can be evaluated using various standard methods. Our product supports two methods:
- ISO 3800, which is mainly used for testing threaded fasteners. This variant evaluates in the fatigue strength range using regression similar to the pearl string method and in the fatigue strength range using the staircase method.
- ASTM E739, which is not limited to a specific application. For example, tests on composites and implants are evaluated based on this method.
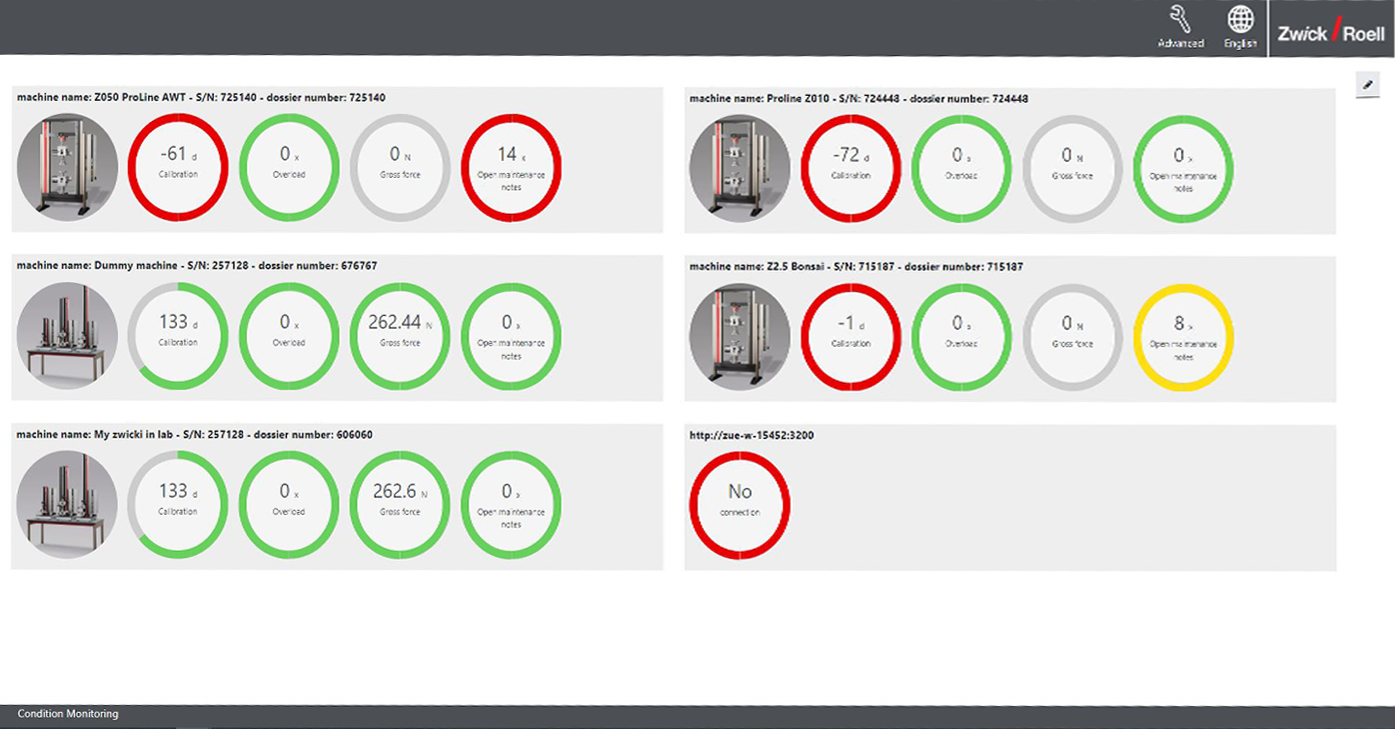
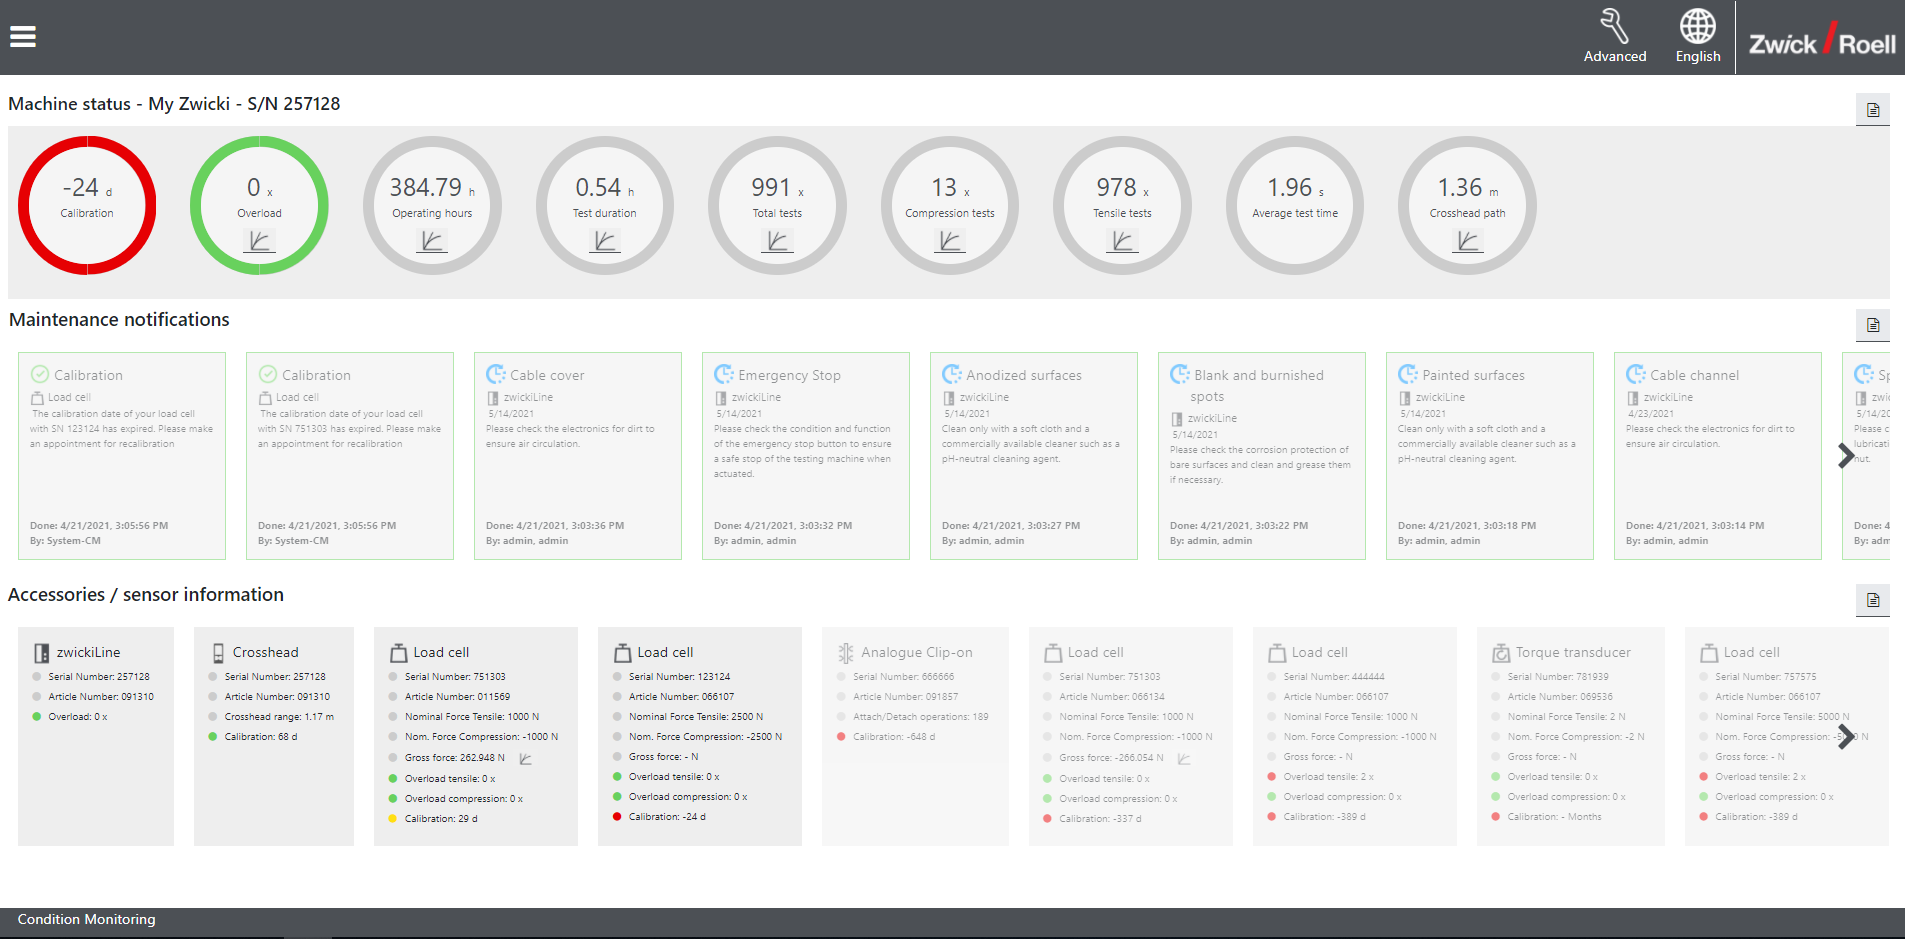
Condition Monitoring: all of your machine data at a glance
Condition Monitoring stores all machine-specific data in a local database on the machine PC. The data can be called up via the machine dashboard or via web browser.
The dashboard displays important messages and information about
- the current machine status (total running time, number of tests, average test time, time period until next calibration, number of sensor overload conditions and much more),
- current maintenance notifications (such as regular scheduled service and maintenance tasks), and
- The currently connected sensors and accessories (such as load cells, extensometers, specimen grips, safety device, and much more).
This information provides a high level of transparency about the testing machine and the accessories used. You have an overview of all of the testing machines in your lab, and critical or upcoming events are signaled.
Re-allocate your administrative tasks!
Do you have a lot of machines to manage? While simultaneously having to keep an overview on maintenance tasks and calibration deadlines? And at the same time minimizing downtime? Then simply re-allocate these maintenance tasks!
Our testXpert Daniel shows you how our Condition Monitoring feature provides the support you need.
Advantages of Conditioning Monitoring
- Maximum transparency on the condition of the testing machine, necessary maintenance, sensors and accessories
- Customizable maintenance tasks in the electronic maintenance guide
- Trends provide an overview of the usage behavior and stresses, and show possible irregularities
- Long-term trend analyses of the machine and sensor conditions
- Information about the condition of the machines, sensors and accessories can be accessed in a proactive manner, and can be received directly via email
- Documentation and traceability of machine activity as well as maintenance checklists via the export function
- Option to create different rights via the user administration feature