S-N Curve / Woehler Curve
The S-N curve indicates the sum of the load changes that can be endured until a material is fractured. It is derived from high cycle fatigue tests by applying a load at constant amplitude (also S-N test) to DIN 50100, and is divided into the regions of low cycle fatigue K, finite life fatigue Z and high cycle fatigue D.
The regions are delimited by the number of cycles N
- Low cycle fatigue100-30,000 cycles
- Finite life fatigue approx. 2,000,000 cycles
- High cycle fatigue to infinity
From the S-N diagram you can read the maximum number of load changes for a certain load amplitude. It is dependent on the material properties, the force and the load application type (pulsating compression load, pulsating tensile load or alternating load).
Description Low cycle fatigue Finite life fatigue high cycle fatigue Software tool Standards Testing machines

The S-N Curve of a Smooth Material Specimen (Stress Ration R = -1)
In our example, the nominal stress amplitude Sa and the number of cycles N are applied logarithmically. In double-logarithmic representation, the region of finite life fatigue represents a straight line. The resulting curve is designated as S-N curve.
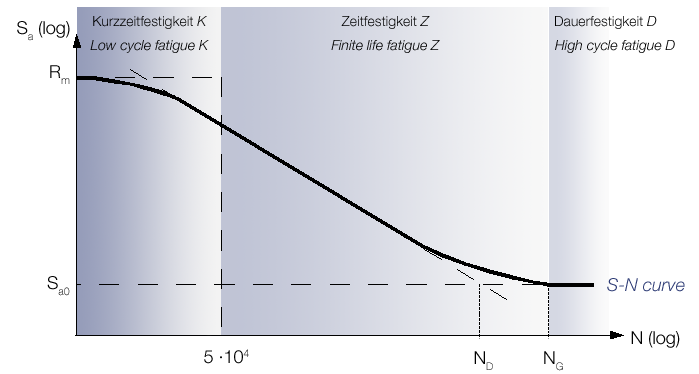
Description of the S-N curve:
- Rm static strength (here tensile strength)
- Sa Nominal stress amplitude
- SaD High cycle fatigue strength
- N Tolerable number of cycles
- ND Edge load number of cycles
- NG Threshold number of cycles
- K Low cycle fatigue / low cycle fatigue strength
- Z Finite life fatigue / finite life fatigue strength
- D High cycle fatigue / high cycle fatigue strength
Low Cycle Fatigue
Low cycle fatigue K is the range below approx. 104 to 105 load cycles.
Low cycle fatigue strength is determined with the low cycle fatigue (LCF) test. In this range, materials and components are stressed to the extent that plastic deformations occur during the cycle, and the material fails at an early stage. The Coffin-Manson model is often used for a more detailed representation.
A load that leads to specimen fracture within a fourth of the cycles, is referred to as static strength, which is also determined with a tensile test.

Finite Life Fatigue
The finite life fatigue Z is the range between 104 and 2·106 cycles (dependent on the material). In the finite life fatigue range the specimen always reaches a failure criterion condition (e.g. crack or fracture).
Finite life fatigue strength is determined with the high cycle fatigue (HCF) test. After the test, the result is the number of load cycles at one load amplitude.

High Cycle Fatigue
High cycle fatigue D denotes the stress limit that a material can endure during cyclic loading without significant signs of fatigue or failure. High cycle fatigue is determined during a high cycle fatigue test .
In the area of high cycle fatigue, a limited number of cycles NG is established. If the specimen fails before reaching this limited number of cycles, it is considered as “failing”. Materials that, during a high cycle fatigue test , endure more than 1,000,000 cycles without fracture are considered to be fatigue resistant.
The high cycle fatigue concept results in significantly lower permissible stresses than the static concept.
The course of the S-N (Woehler) curve in the high cycle fatigue range is divided into 3 types:
- Horizontal course of the S-N curve: The pronounced high cycle fatigue strength or long-term fatigue strength frequently occurs with ferritic steels
- Further drop of the S-N curve with a lesser inclination: often occurs with austenitic steel or aluminum
- After an initial horizontal course, the S-N curve drops at about 108 cycles: internal defects cause cracks below the surface


Standards Relevant for Determination of the S-N Curve
- DIN 50100 - Load controlled fatigue testing – Execution and evaluation of cyclic tests at constant load amplitudes on metallic specimens and components
- ASTM E466-15 - Standard Practice for Conducting Force Controlled Constant Amplitude Axial Fatigue Tests of Metallic Materials
- ISO 1099 - Metallic materials - Fatigue testing - Axial force-controlled method
- DIN EN 6072 - Aerospace series - Metallic materials - Test methods - Constant amplitude fatigue testing